Saving Time is Saving Money

Building automation, building management systems, energy management systems, tenant billing

Saving Time is Saving Money

with Optergy Building Management System

Play Video

Installing building management systems in small buildings can be very cost effective. For end-users it’s easy to imagine a building you know that often leaves lights or HVAC on when the system really should not be running, it’s not hard to see that small buildings can pile up huge bills. In fact much of the buildings load (~70%) can be controlled simply and economically.

For contractors, simple and economical means they have access to products like Proton that can help provide high performing small buildings with building and energy management. All this in under a hour? Yes! watch our friend Marc put together a small EMS and BMS project in under an hour.
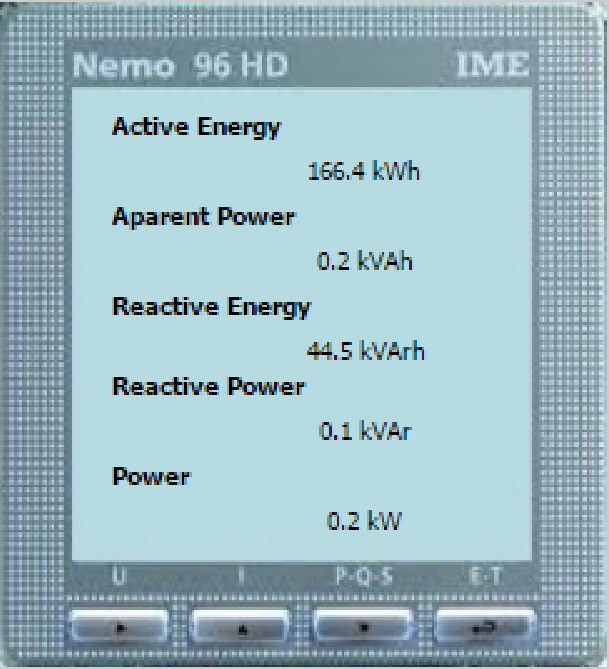
To become a reseller or for more information contact us or email us at info@optergy.com.

Turn your buildings utility data into a meaningful story

Turn your buildings utility use into a meaningful story

Optergy Energy Management System

Figure 1. Numbers represented on a screen making it hard to understand and find patterns.

When all you have is a utility bill with a single number representing this month’s or quarter’s consumption, it can be extremely hard to understand what story a building is telling about its performance. As a consequence, most people end up dreading their utility bills because they have no insight until the bill arrives and it’s too late.

Sadly, many buildings have smart metering systems installed. However most of the time, the data is not being collected or is communicated to the user in a meaningless way. Take the example of a monitoring system reporting a current usage of 0.2 kW and an active energy of 166.4 kWh. When these valuable pieces of information are presented as only numbers on a screen it becomes difficult for the user to gain any real insight or find patterns. Numbers on a screen can show what’s happening live, but nobody has time to watch a screen 24 hours a day. As a result, the numbers become meaningless and an endless source of frustration as building owners revert back to waiting for their utility bills to arrive.

There is a need for a smart metering system to tell the user a story. It should report the story in real time and break it down into manageable chunks of 15min intervals (or less). It should tell the story with hourly, daily, weekly, monthly, yearly data. It should allow the user to run graphical reports comparing period on period, or usage versus ambient conditions. It should allow the user to view the building as a whole, then drill down through major load groups to end loads with a few simple clicks. It needs to allow the user to receive the story in a way that makes sense to them.

The work flow of user customisable reports.
The user has enough flexibility to tell the story in a way that makes sense to them.

By having data that is easily visualised, it becomes engaging. Once something is engaging, it becomes habit. If it becomes a habit, it becomes easy. All of a sudden what was once frustrating numbers on a screen, becomes the building owners greatest tool for utility cost reduction and improved efficiency. This system is now valuable and begins to save money through utility bills by allowing the user to visualise performance, find abnormalities and take action before the next utility bill arrives.

 
Figure 3. Example of a meaningful report. Area chart for all major building load groups over a 24 hour period. Shows abnormal profile for chilled water plant and AHU’s on start up. Exceeding normal operational consumption, peaks need to be tuned out of the automation system.

How to effectively visualize and manage multiple equipment simultaneously

How to effectively visualize and manage multiple pieces of equipment simultaneously

Central energy plants (chillers and boilers) are the most critical components of a building's infrastructure. Not only are they the most energy-hungry, they also have the biggest impact on internal conditions when things go wrong. The question is, how can you effectively visualize and manage a central energy plant, internal building conditions AND energy efficiency all at the same time?

Inefficiency or failure of major building infrastructure like chillers or boilers can be one of the biggest concerns a building owner has. The reasons for this include:

  • Chillers and boilers are the most energy hungry pieces of plant within a building – small inefficiencies equals big energy waste and big energy expense
  • Inefficient plant not only results in higher than normal energy expense, but usually goes hand in hand with premature wear and higher than expected maintenance costs
  • Failure of these major pieces of plant usually affects all building occupants – mass complaints from tenants when things go wrong
  • If the building is a data center, laboratory or houses food stocks – losses into the millions of dollars’ worth of lost transactions or spoilt stock can be easily achievable in a measly few hours

If any of these things goes wrong, the impact for a building owner can be much higher than simply replacing or repairing the failed piece of plant and angry tenants. The end result can include:

  • Loss in rent as tenants move out
  • Loss of credibility in the market leading to;
  • Long vacancy periods
  • Lower asset value
  • Legal action taken to recover tenant losses

To be able to avoid these catastrophic outcomes, there is a need for visibility and control of major building systems so that indoor environment conditions can be controlled and tuned, energy efficiency can be managed and early intervention can be made when problems arise affecting tenant conditions.

The simplest way to do this is to implement a building automation system which integrates the central energy plant and other major plant and equipment in a building and takes control of all operation. If this is done well, all building subsystems will work together and provide feedback to the central energy plant to ask for more or less cooling/heating.

Smart Alerts

Building automation, building management systems, energy management systems, tenant billing

Smart Alerts

Contextual alarming that cuts across silos of information is Smart Alarming

Problem

As a building operator or contractor, how many times have you been woken up in the middle of the night or arrived at work in the morning only to be greeted by a long list of alarms. Your stomach sinks, coffee goes cold and you begin the painful task of scrolling through both building automation and energy management silos only to find alarms filled with messages like:

Chiller-1 Fault

CHWP-1 Fault

MSSB-1 Excessive consumption

Next alarm with little meaning or context…

The technician who setup the alarms knows what they mean, how to address, and how to solve them. Unfortunately, that technician has long left the company, leaving the building operator and new technician to inefficiently use their time trying to diagnose and fault find. Many hours later the technician diagnoses the problem but by this stage the building operator and occupants are already complaining.

When limited information can be used to generate alarms, there is limited ability to add context so that a user can interpret what the alarm means. The higher the alarm count, the higher the frustration levels and the more alarms begin to become ignored. Once alarms begin to be ignored, they can become dangerous. Once they become dangerous they become expensive. When alarms are ignored and go unnoticed, the results can be more catastrophic and physically damaging. Frequent alarms cause frustrated users to treat them as noise and nuisance rather than actionable alerts.

Effects

Failure of mechanical plant can be one of the biggest concerns of a building operator or owner. When a building is home to people and equipment that is sensitive to temperature, if any of the buildings plant fails the impact for a building owner can be much higher than simply repairing the failed piece of plant and angry tenants. The end result can include:

  • Higher than expected energy costs
  • Expensive repair costs
    Loss in rent as tenants move out
  • Loss of credibility in the market leading to;Long vacancy periods
    • Lower asset value
    • Risk legal action is taken to recover costs of spoilt experiments, medicines or food stocks

Examples of the direct costs can be quantified – see figure 1 below. However, the indirect costs are usually more significant and harder to quantify. For example; if a laboratory loses conditions for an extended duration because chiller alarms are being ignored, a whole experiment or laboratory of experiments could be lost. Experiments can be tracked and monitored over years, multiple laboratories or even passed on from scientist to scientist. The costs of losing these experiments can extremely be substantial.

Direct Costs

Fault
Action Taken
Costs
Unnoticed peak demand costs plus increased energy consumption
No action taken due to lack of awareness
Increased energy costs by ~15%
Chiller compressor failure
Cost of compressor, labor and loss of conditions in building
Thousands

Indirect Costs

Fault
Action Taken
Costs
Laboratory experiments over temperature. Years of ongoing research ruined
No action taken due to lack of awareness
Thousands
Loss in rent as frustrated tenants move out
Loss of credibility in the market leading to
Long vacancy periods
Lower asset value
Legal fees
Loss in rent as frustrated tenants move out
Loss of credibility in the market leading to;
Long vacancy periods
Lower asset value
Legal fees
Thousands

Need & Solution

To avoid these costs and catastrophic outcomes there is a need for early intervention and smarter alarming with context. Combining information from a Building Management System (BMS) and Energy Management System (EMS) enables smarter alarming with context. By having smarter alarming with context, what used to be nuisance and noise becomes an informative notification, advising what has occurred and what steps must now be taken to rectify the issue. What used to be an ignored or nuisance alarm with message stating:

“Chiller-1 Fault”

Can become a useful notification advising problem and potential solution:

“Chiller Plant Performance Alert”
Chiller 1 running at 100% and consuming excessive energy. Bypass valve closed with high water flow through vessel and low heat transfer. Air handling units starved of chilled water causing space temperatures inside the building to increase. Most likely chiller bypass valve actuator failed or valve jammed in open position. Call mechanical technician immediately. Click here to check Energy and Trend-log analysis report Optergy/Chiller_1_report

Benefits

This is a smarter more useful alarming system less likely to be ignored by users. Once a system is capable of outputting smarter alarms with context by email, SMS or push notification to a mobile phone they can be actioned much faster reducing costs from figure 1, to a simple callout with replacement part:

Fault
Action Taken
Costs
Chiller Plant Performance Alert
Alarm for mechanical plant showing overuse in the chiller plant. Compressor overload. Service callout, found bypass valve actuator faulty. Replaced actuator and returned plant to normal operation within few hours. Once off rectification cost
Hundreds

Optergy is a system that can be installed as a combined BMS & EMS solution or can add functionality to an existing BACnet BMS system. Using a common web browser Optergy can generate alarms, pop up notifications, email alarms, smart phone push notifications and SMS. Smart alarms can be sent to specific users or groups during specific time periods. A unique feature of Optergy software is its ability to escalate alarms to a different user(s) if an alarm goes unanswered. This ensures that critical alarms will never go un-actioned.

Progress Against Budget Reporting

Progress Against
Budget Reporting

Optergy’s Building Management System

How to Manage Design Expectations And Reality

With the cost of energy sky rocketing in most developed countries, it’s becoming more and more important to effectively manage its consumption. One of the major problems is that energy is mostly invisible making it hard to see excessive use or waste. The easiest way to think about energy consumption is to compare it to water.

For example; when you take a shower before work in the morning, with a small turn of a tap on the wall you can control the amount of water coming from the shower head. The water can be trickling out slowly or blasting out excessively. As long as the temperature is ok, it doesn’t matter whether the water is trickling or blasting. The outcome is that you have comfortably cleaned yourself in preparation for the day ahead.

Energy is much the same. If we can see its excessive use, we can adjust the ‘tap’ to trickle and achieve the same satisfaction and outcomes with less energy and cost. The key is visibility.

If you are a building owner, facilities manager or controls contractor in-charge of either an existing building or one that’s been recently delivered from construction and its energy performance is not meeting your expectations, don’t worry you’re not alone.

In most cases during a building’s design phase its energy performance has been modelled. Unfortunately, there is a disconnect between the time of modelling and the delivered building and sub-metering system, making it difficult to correlate the buildings actual performance back to the original model. Due to this disconnect, the detailed breakdown of the building by energy load group is mostly shelved with the operator’s visibility being limited to total building consumption. This single value is then used to benchmark the overall performance back to the model.

Buildings rarely perform as expected, which leaves operators frustrated with the delivered result. With the model on the shelf and only total consumption to benchmark the entire building, the operator is left with limited visibility to drill deeper and understand which load group is consuming in excess. These frustrations lead to tension between operators, designers and contractors along with days, weeks or months of lost time trying to understand the black hole of consumption. As a building operator, you are lucky if these problems are identified during the defects and liability period. The excessive cost of energy you will bear for a short time, but the expensive hours of diagnosis are on the consultant and contractor. If outside the defects and liability period, these costs are on you for the entire period the building performs poorly. In some cases, this can be years.

There is a need to be able to track a building’s designed energy model against its actual performance. Building operators need three things to be able to achieve this.

Designed energy model by load group
The building’s sub-meters broken down by load group; and
Ability to track each load group against the designed energy model
Using an energy monitoring system, it should be easy to sub-meter the various pieces of plant and then aggregate together to create load groups. Then the model for each load group can be entered and tracked against. Load group types include (not limited to):

Chiller Plant
Air Handling
Car park Ventilation
Toilet and General Ventilation
Lifts
Lighting
General Power
With this approach operators can see at a glance which load groups are performing as expected and which are not. From here operators know where to concentrate their efforts and can drill down to the source of a problem quickly. This is a great way for existing buildings to gain visibility and then turn the ‘tap’ down to trickle to begin their journey towards high energy performance and lower overall costs.

For new buildings this method enables a source of truth and analytics on how systems perform all the way from the design phase, to delivery and day to day operation.

In both scenarios this saves hours of time on diagnosis and highlights load groups which are consuming energy excessively, causing higher than expected utility costs. It also removes blind guess work from building tuning and optimization giving the operator direct feedback of where to focus.

There are many metering systems on the market that can provide the visibility describe. However, Optergy is a software company that does things a little differently providing unique advantages. Optergy allows integration, monitoring and control of a buildings HVAC, hydraulic and lighting systems along with sub-metering systems all on the one platform.

Optergy includes a pre-built energy management application for automated reporting. One of the many reporting options is called Progress Against Budget Reporting. This allows operators to track a buildings design energy model against actual performance.

Using the Progress Against Budget reporting, operators can analyze performance by load group and then make changes to how a buildings HVAC, hydraulic and lighting systems operate all from the same software interface and platform. If issues are found or certain load profiles are not meeting expectations, then HVAC, hydraulic and lighting systems can then be monitored and tuned through one interface, putting the power back into the building operator’s hands.

Here’s an example provided by one of Optergy’s channel partners in Australia. This buildings energy model was based on a 5.5 NABERS energy star rating. The energy model was provided by the design consultant to the contractor. The contractor then implemented a sub-metering system which divided the building up by major load group and entered in the design model to track each load group against the design. The blue bars represent actual performance with the red representing the model.
 

Dashboards, Enabling Passive and Active Energy Management

Take Ownership of Your
Energy & Costs

with simple dashboarding

Enabling passive and active energy management with dashboards

Most building owners and operators struggle to incentivize occupants to change their behavior when it comes to sustainability. How many times have you asked your son or daughter to turn the lights off at home when not in a room or take less time in the shower to save energy and water? Despite best efforts to install solar hot water, solar PV or water saving taps the kids just keep consuming and driving utility bills skyward. We all know it’s hard to drive change when the effects of an individual’s actions are not directly seen or felt by that individual.

In recent blog posts we discussed visualization of utilities data. Taking what was once invisible and representing in a way that is easy for individuals to understand and draw insight.

We discussed how visualization of energy and control is important for building owners and operators because the results of building tuning can be seen and a constant feedback loop can be put in place.

This visualization technique need not be restricted to building owners or operators.

Just like your kids at home, in a commercial building environment the occupants of a building have influence over the utilities consumption without seeing or feeling that influence directly. 

For example, a lack of visibility for building occupants means they are less likely to turn the lights and air-conditioning off in meeting rooms when left un-occupied. The effects of this behavior are felt by the building owner and the tenant’s facility manager but not by the day to day occupants.

Owners feel this through:

  • Increased wear and tear on lighting through longer run hours
  • Increased wear and tear on meeting room air-conditioning units through longer run hours
  • Increased wear and tear on condenser water systems
  • Increased maintenance costs
  • Increased capex costs due to shorter life spans from excessive load and operating hours
  • Increased carbon emissions
  • Lower energy star rating

Tenants facility manager feels this through:

  • Increased utilities costs
  • Increased carbon emissions
  • Lower energy star ratings

The effects of increased utilities, carbon emissions and lower overall energy star ratings need to be visible for both building operators and occupants. There is a need for dashboards and displays to be visible so that the effects of behavior can be seen directly through a constant feedback loop. These effects need to be visualized in a way that is relatable to help provide positive reinforcement of behavioral change.

The solution is to implement a system like Optergy that can take building and tenancy information and display it through user customizable dashboards. User customizable dashboards allows multiple stakeholders within a building to visualize information that is relevant to their day to day operations.


User dashboards allows tenants to create occupant centric displays to share information that drives behavioral change.

Occupant centric dashboard information can include:

  • Energy efficiency initiatives implemented
  • Handy tips for conserving energy in the office
  • News on global warming and the greenhouse effect
  • Results of progress against targets
  • Savings achieved (dollars and carbon emissions)


For building occupants, a dashboard showing lighting and air-conditioning for meeting room energy consumption and costs. Shows occupants the effects directly when lighting and air-conditioning is switched off.

For occupants an educational dashboard showing water saving initiatives implemented in their building.

Water Usage

Using water efficient fixtures and appliance means we can reduce the amount of water we use in building 

Our dishwasher is rated 5 star for water efficiency

all our taps are filled with aerators 

Movement sensors installed to avoid water wasting

Efficient Appliance

Energy and water efficient appliance for 

Heating

Cooling

Lighting

contribute to our 5 Star Green Star Rating

For occupants an educational dashboard stating the organization has chosen efficient appliances

Optergy is a combined building automation and energy management system. Combining both systems and displaying information in a meaningful way through dashboards for building operators and occupants helps align all stakeholders working towards efficiency both actively and passively.

The significance and effects of real time dashboard visualisation on building occupants was studied by Petersen et al (2007) from Oberlin College Ohio, USA. The college completed a study of building occupants and their behaviour when exposed to real-time visual feedback of energy and water usage. Extract of the study below:

Abstract

Purpose:

In buildings, personal choices influence electricity and water consumption. Prior studies indicate that information feedback can stimulate resource conservation. College dormitories provide an excellent venue for controlled study of the effects of feedback. The goal of this study is to assess how different resolutions of socio-technical feedback encourage students to conserve resources.

Design/methodology/approach:

An automated data monitoring system was developed that provided dormitory residents with real-time web-based feedback on energy and water use in two “high resolution” dormitories. In contrast, utility meters were manually read for 20 “low-resolution” dormitories, and data were provided to residents once per week. For both groups, resource use was monitored during a baseline period and during a two week “dorm energy competition” during which feedback, education and conservation incentives were provided.

Findings:

Overall, the introduction of feedback and education resulted in a 32 percent reduction in electricity use (amounting to savings of 68,300 kWh, $5,107 and 148,000 lbs of CO22). Dormitories that received high resolution feedback were more effective at conservation, reducing their electricity consumption by 55 percent compared to 31 percent for low resolution dormitories. In a post-competition survey, students reported that they would continue conservation practices developed during the competition and that they would view web-based real-time data even in the absence of competition.

Click here to view the full study.

The results of this research provide evidence that real-time visual feedback systems, when combined with education can motivate and empower building occupants to reduce utility use. The more detailed the feedback, the more energy was saved, indicating that detailed real-time dashboarding data is extremely important to drive energy performance within buildings.

Are you a building owner of facilities manager in need of user specific real-time dashboards to manage your building more effectively or to help drive behavioural change amongst building occupants? Contact us now to find out how to boost your productivity with a visual platform that centralizes all your buildings to improve the way you and your team work.

Indoor Environment Quality Tool to Support NABERS IE Reporting

Indoor Environment Quality Tool

Introducing an Indoor Environment Quality Tool to support NABERS IE reporting

Have you ever had to compile reports for NABERS Indoor Environment rating? If you have, you would know that in order to do proper Indoor Environment Quality reporting you need to have compliant report format and data setup for 15 minute intervals.

NABERS Indoor Environment

Optergy has developed the NABERS Indoor Environment (NABERS IE) compliant tool called the Indoor Environment Quality (IEQ) Module to simplify NABERS IE reporting. With this tool the user can use its normal trendlogs to create NABERS compliant user interface and reports. The IEQ module has tools to help report on Thermal services, including temperature, mean radiant temperature, humidity and air speed, in accordance with NABERS IE guidelines.

The IEQ module is available as an option to Proton or OE (v 2.4.12 and later). This software can be easily added to an existing Optergy system or any BACnet BMS. This means you can save a lot of time and effort gathering report data with the IEQ tool.

If you want to learn more about NABERS IE, you can obtain a copy of the NABERS IE guide here.

We know that NABERS IE reporting can be a gruelling process, and we believe it’s our responsibility to arm our clients with the insights that they need to simplify the process and be successful. 

Clean & Fast Energy

Sed ut perspiciatis unde omnis iste natus error sit voluptatem accusantium doloremque laudantium, totam rem aperiam, eaque ipsa quae ab illo inventore veritatis et quasi architecto beatae vitae dicta sunt explicabo.

Continue reading

Unlimited Energy for Future

Sed ut perspiciatis unde omnis iste natus error sit voluptatem accusantium doloremque laudantium, totam rem aperiam, eaque ipsa quae ab illo inventore veritatis et quasi architecto beatae vitae dicta sunt explicabo.

Continue reading

Solar Panel Technologies

Sed ut perspiciatis unde omnis iste natus error sit voluptatem accusantium doloremque laudantium, totam rem aperiam, eaque ipsa quae ab illo inventore veritatis et quasi architecto beatae vitae dicta sunt explicabo.

Continue reading