Take Ownership of Your
Energy & Costs
with simple dashboarding
Enabling passive and active energy management with dashboards
Most building owners and operators struggle to incentivize occupants to change their behavior when it comes to sustainability. How many times have you asked your son or daughter to turn the lights off at home when not in a room or take less time in the shower to save energy and water? Despite best efforts to install solar hot water, solar PV or water saving taps the kids just keep consuming and driving utility bills skyward. We all know it’s hard to drive change when the effects of an individual’s actions are not directly seen or felt by that individual.
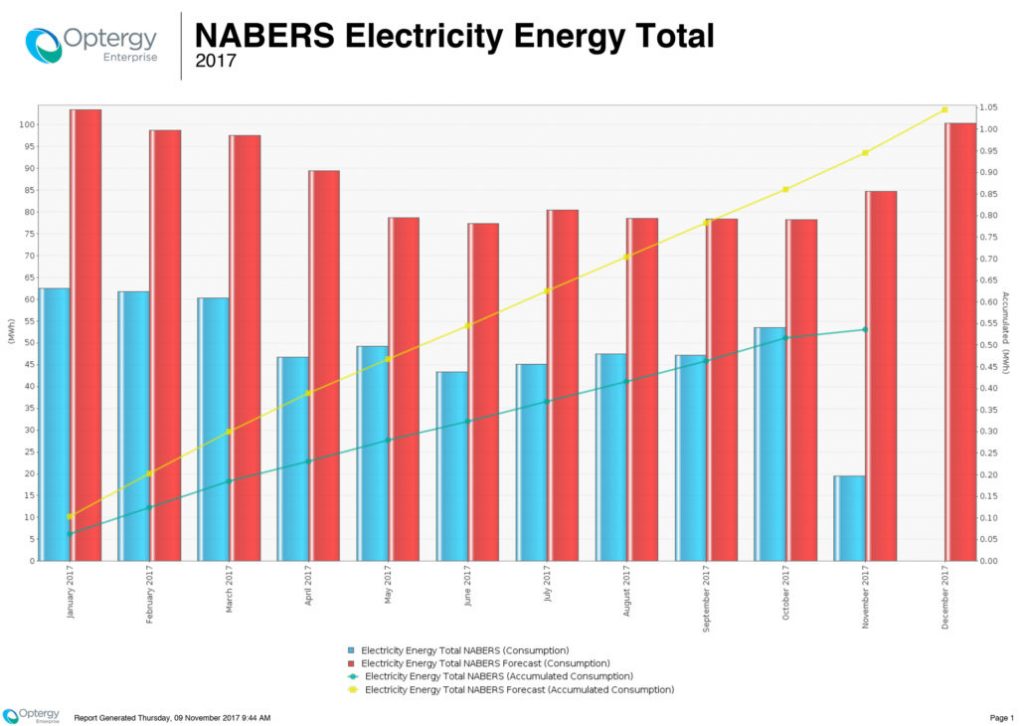
In recent blog posts we discussed visualization of utilities data. Taking what was once invisible and representing in a way that is easy for individuals to understand and draw insight.
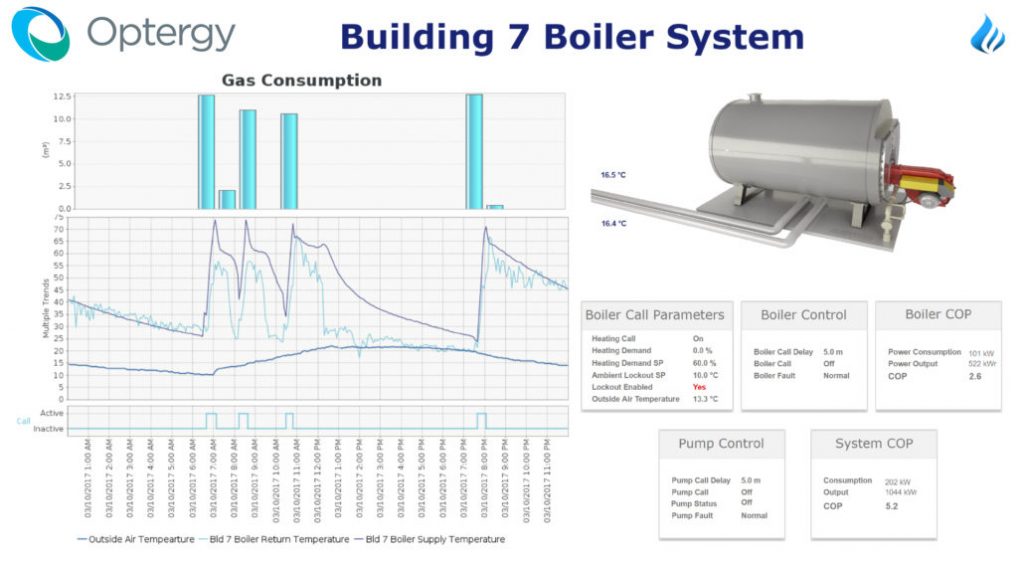
We discussed how visualization of energy and control is important for building owners and operators because the results of building tuning can be seen and a constant feedback loop can be put in place.
This visualization technique need not be restricted to building owners or operators.
Just like your kids at home, in a commercial building environment the occupants of a building have influence over the utilities consumption without seeing or feeling that influence directly.
For example, a lack of visibility for building occupants means they are less likely to turn the lights and air-conditioning off in meeting rooms when left un-occupied. The effects of this behavior are felt by the building owner and the tenant’s facility manager but not by the day to day occupants.
Owners feel this through:
- Increased wear and tear on lighting through longer run hours
- Increased wear and tear on meeting room air-conditioning units through longer run hours
- Increased wear and tear on condenser water systems
- Increased maintenance costs
- Increased capex costs due to shorter life spans from excessive load and operating hours
- Increased carbon emissions
- Lower energy star rating
Tenants facility manager feels this through:
- Increased utilities costs
- Increased carbon emissions
- Lower energy star ratings
The effects of increased utilities, carbon emissions and lower overall energy star ratings need to be visible for both building operators and occupants. There is a need for dashboards and displays to be visible so that the effects of behavior can be seen directly through a constant feedback loop. These effects need to be visualized in a way that is relatable to help provide positive reinforcement of behavioral change.
The solution is to implement a system like Optergy that can take building and tenancy information and display it through user customizable dashboards. User customizable dashboards allows multiple stakeholders within a building to visualize information that is relevant to their day to day operations.
User dashboards allows tenants to create occupant centric displays to share information that drives behavioral change.
Occupant centric dashboard information can include:
- Energy efficiency initiatives implemented
- Handy tips for conserving energy in the office
- News on global warming and the greenhouse effect
- Results of progress against targets
- Savings achieved (dollars and carbon emissions)
For occupants an educational dashboard showing water saving initiatives implemented in their building.
Water Usage
Using water efficient fixtures and appliance means we can reduce the amount of water we use in building

Our dishwasher is rated 5 star for water efficiency
all our taps are filled with aerators
Movement sensors installed to avoid water wasting
Efficient Appliance
Energy and water efficient appliance for
Heating
Cooling
Lighting
contribute to our 5 Star Green Star Rating
For occupants an educational dashboard stating the organization has chosen efficient appliances
Optergy is a combined building automation and energy management system. Combining both systems and displaying information in a meaningful way through dashboards for building operators and occupants helps align all stakeholders working towards efficiency both actively and passively.
The significance and effects of real time dashboard visualisation on building occupants was studied by Petersen et al (2007) from Oberlin College Ohio, USA. The college completed a study of building occupants and their behaviour when exposed to real-time visual feedback of energy and water usage. Extract of the study below:
Abstract
Purpose:
In buildings, personal choices influence electricity and water consumption. Prior studies indicate that information feedback can stimulate resource conservation. College dormitories provide an excellent venue for controlled study of the effects of feedback. The goal of this study is to assess how different resolutions of socio-technical feedback encourage students to conserve resources.
Design/methodology/approach:
An automated data monitoring system was developed that provided dormitory residents with real-time web-based feedback on energy and water use in two “high resolution” dormitories. In contrast, utility meters were manually read for 20 “low-resolution” dormitories, and data were provided to residents once per week. For both groups, resource use was monitored during a baseline period and during a two week “dorm energy competition” during which feedback, education and conservation incentives were provided.
Findings:
Overall, the introduction of feedback and education resulted in a 32 percent reduction in electricity use (amounting to savings of 68,300 kWh, $5,107 and 148,000 lbs of CO22). Dormitories that received high resolution feedback were more effective at conservation, reducing their electricity consumption by 55 percent compared to 31 percent for low resolution dormitories. In a post-competition survey, students reported that they would continue conservation practices developed during the competition and that they would view web-based real-time data even in the absence of competition.
Click here to view the full study.
The results of this research provide evidence that real-time visual feedback systems, when combined with education can motivate and empower building occupants to reduce utility use. The more detailed the feedback, the more energy was saved, indicating that detailed real-time dashboarding data is extremely important to drive energy performance within buildings.
Are you a building owner of facilities manager in need of user specific real-time dashboards to manage your building more effectively or to help drive behavioural change amongst building occupants? Contact us now to find out how to boost your productivity with a visual platform that centralizes all your buildings to improve the way you and your team work.